
A Practitioner's Guide to Paid Search Incrementality | Part 2 of 3 — Four Ways to Find Out If Your Paid Search Is Actually Working
Welcome back to incrementality!
In Part 1, from last week’s blog, we made the case that platform attribution measures correlation, not causation, and that the gap between attributed and incremental performance is usually bigger than teams expect. Now the practical question: how do you measure the real number?
Most teams pick one methodology and call it done. We understand the impulse. Measurement is hard, and any single test feels like a step forward. But each method has blind spots, and the picture gets sharper when you triangulate.
Today we’re talking four different measurement methodologies and what one of our DTC clients learned running all four on the same account.
(Reminder that we are hosting a Webinar on August 12th to answer any all your questions on incrementality. Register for the webinar here →)
1. Natural experiments: the "oh no" pause
Sometimes a campaign accidentally pauses for a day. Sometimes a budget caps out. Sometimes a feed breaks. These moments feel awful in real time, and we've sat with plenty of teams in that "what just happened" panic. But they're actually gifts, even if they don't feel like it in the moment.
Spend drops to zero, and you get to watch whether conversions follow. If conversions hold steady when the ads go dark, the ads probably weren't doing as much work as they got credit for.
For our DTC client, a one-day accidental pause on Non-Brand Search produced one of the most striking pieces of evidence in the entire program. Total Google Search spend dropped sharply, and conversions barely moved. Even more telling, Facebook volume, CVR, and CPA all improved during the pause. Google had been quietly claiming credit for conversions Facebook was actually driving.
Strengths: zero cost, real business-level signal. Limitations: uncontrolled, single-day. Directional, not definitive.
2. Conversion Lift Studies (CLS): user-level randomization
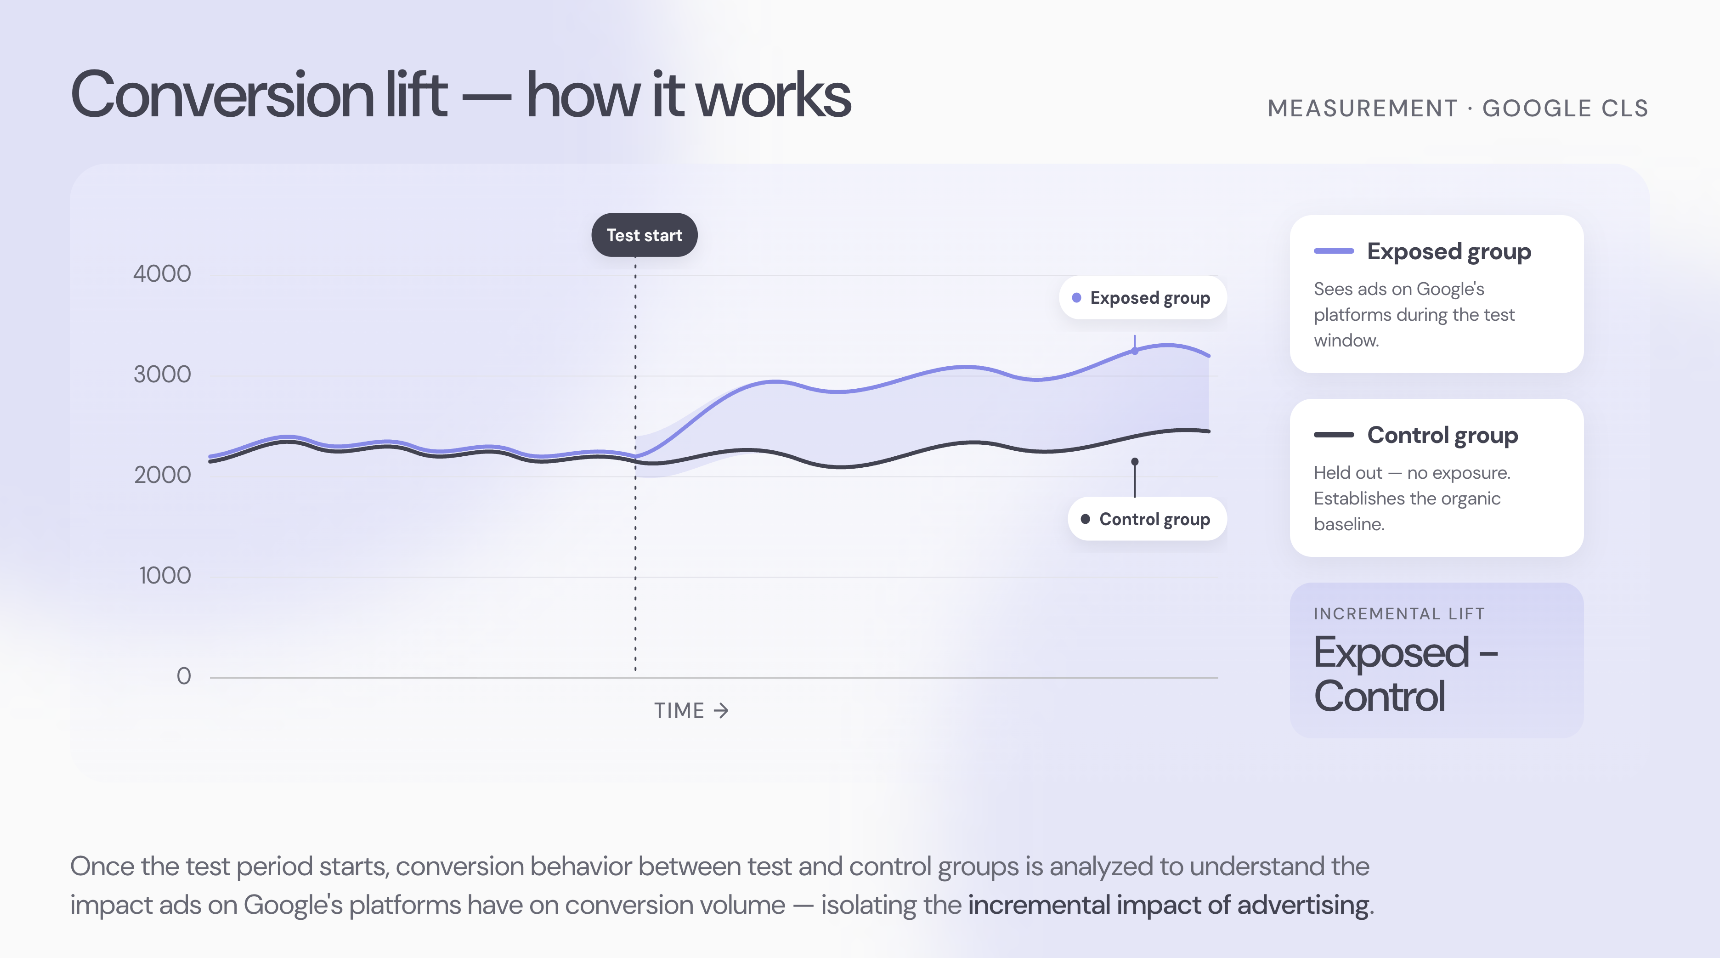
This is Google's in-platform randomized controlled trial. They split your audience into a test group that sees your ads and a holdout that's prevented from seeing them. The difference in conversion rates is the causal lift. It's the cleanest test most teams have available, and our team leans on it heavily as a starting point.
For Non-Brand Search + PMax, the CLS landed on a 59% incrementality factor, with a measured conversion lift of 182% at 100% statistical confidence. Strong, real, and very much worth investing behind.
For Brand Search, it was a very different story. Just 19% incrementality. Roughly 4 out of every 5 conversions Google attributed to branded ads would have come anyway, through organic search, direct, or another channel. We know that number stings, especially for teams who've spent years building a strong brand. But it's also exactly what the research predicts.
That 19% lines up with Google's own research: branded search is only ~50% incremental when a strong organic result exists, and 100% when one doesn't. A strong brand with strong organic presence will see lower brand search incrementality, not higher. Counterintuitive, but consistent. The better your brand performs everywhere else, the less your brand search ads are actually adding on top.
One important caveat we always check before drawing conclusions: competitor conquesting. If rivals are actively bidding on your brand terms, the math shifts. Their ads can siphon off branded traffic that would otherwise have flowed to your organic result, which raises the defensive value of your own brand search ads, and with it, their incrementality. Before assuming your brand search spend is wasted, pull the auction insights report. If competitors are showing up consistently on your brand SERPs, a chunk of that spend is doing real work, just not the work the dashboard is crediting it for.
Brand search is your center-back. It doesn't score, but it stops the other team from doing it on your turf.
The CLS also surfaced upper-funnel lift: 42% on Add to Cart, 26% on Lead Form Submission, 10% on Membership Opt-In. Good signals that the work is doing more than the last-click view suggests.
3. Customer surveys: useful, but biased
You email recent converters and ask them: had you heard of us before clicking? Would you have signed up without the ad? It's cheap, qualitative, and easy to scale, and our team likes having it in the mix as a sanity check.
Our DTC client's survey came back with a self-reported incrementality of 76%, the highest number in the program, and almost certainly the least reliable.
That's not a knock on the customers. People are just genuinely bad at predicting their own counterfactual behavior, all of us are. We underestimate how much advertising shapes our choices. Surveys are great for where customers first heard about you. In this case, the majority of brand-aware respondents first encountered the brand on TV, through word of mouth, or on Facebook. Not search. Surveys are not great as a primary incrementality read, and we'd never lean on them alone.
Strengths: cheap, useful for cross-channel discovery texture. Limitations: self-reporting bias inflates the answer. Weight accordingly.
4. Geo-based holdout tests: business-level truth
This is where it gets serious, and we won't pretend it's easy to set up. You group DMAs into matched cells based on historical conversion volume and trends, then vary spend across cells: one cell at BAU, one at reduced bids, one with spend cut entirely. The difference in total (not just attributed) conversions across cells reveals the causal impact.

Validation matters. You want your test and control groups balanced on conversions, revenue, active users, and daily trend correlation before you ever start. Skip this step and you're measuring noise, which is a painful place to end up after weeks of work.
For our DTC client, the geo test ran across multiple matched DMA groups split into three cells. The headline results:
- BAU cell incrementality: ~48% (directionally consistent with the 59% CLS)
- Lower-bid cell (a 40% bid reduction): incrementality dropped to ~23%
That second finding is the one that should make every search marketer pause, and it certainly made us stop. Lowering bids, the thing most teams reach for when efficiency slips (and we've recommended it ourselves in the past), reduced incrementality. Not the other way around.
Here's why: at lower bids, Google's algorithm shifts toward users whose intent is already high. People who saw your TV ad and then searched. People who were planning to find you anyway. Those users convert at a great CPA on paper, but they convert with or without your ad. You haven't gotten more efficient. You've just bought more passengers.
Strengths: measures business-level conversions including organic, captures cross-channel effects, longer windows, more stable reads. Limitations: geo matching is hard, external noise (TV clearance, seasonality) creeps in, real opportunity cost in the holdout cells.
Triangulating the answer
Four methods, one account, one channel. Here's the range we landed in:
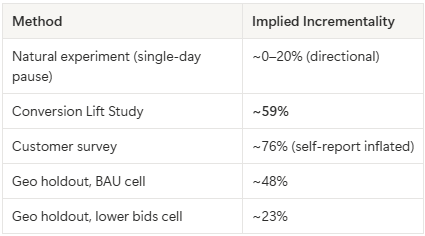
The CLS is the most statistically rigorous and gets the most weight from our team. The geo test validates it at the business level. The survey overstates, as surveys do. The natural experiment is directional but compelling.
Our honest read on Non-Brand Search for this account: roughly 6 in 10 conversions are real. On Brand Search, it's closer to 2 in 10. Those numbers were hard for the client to hear at first, and they were hard for us to deliver. But once everyone was looking at the same picture, the strategy conversation finally moved forward.
Knowing the number is the easy part. Doing something with it is where most programs stall. That's the last post. Stay tuned!
On August 12th, Het is walking through the full program live. Including the geo test design, the calibration math, and how to actually act on the numbers. [Register for the webinar here →]





The author




.svg)


