How to use attribution models to improve your unit economics
Unit economics refers to the financial metrics that measure the profitability of a business model in terms of revenue and cost per unit (user, client, etc.). By analyzing unit economics, businesses can determine both whether their products or services are profitable and how they can improve their margins.
Three pillars of unit economics are customer acquisition cost (CAC), cost of goods sold (COGS) and lifetime value (LTV). When LTV-(CAC+COGS) is greater then zero we’re seeing positive unit economics, and once that number, multiplied by the N of units, exceeds operating costs of the company, we see a bottom line profitable business. This is why understanding each of these numbers is vital for any venture. They all deserve an article but, as marketers, we focus on the CAC part.
Acquisition cost in unit economics
The above formula makes it obvious that there are only 3 main ways to improve unit economics:
- Reduce CAC
- Reduce COGS
- Increase LTV
It is often quite hard to reduce the COGS part of the equation. Let’s say you sell physical items and face real production costs, which are hard to reduce without scaling up the volume or decreasing the quality. Increasing the LTV part is hard for subscription products because it mostly depends on how useful (and addictive) your product is. If you simply increase price, you risk losing existing clients and lowering conversion (essentially, increasing CAC). Only Netflix gets away with this!
As marketers we might be biased, but it seems like bringing down your acquisition cost is the lowest hanging fruit. If, in a perfect world, CAC and COGS were both at 30% of LTV, then reducing CAC by 10% would increase the bottom line profitability by 7.5%. It might be harder to achieve the same effect by reducing COGS by 10%.
Ways to reduce CAC
Now we’re determined to reduce the CAC. Let’s look at our options:
- Optimize the existing paid channels to get more clients spending the same amount
- Unlock new paid channels that have lower CAC from the start
- Increase the share of organic conversions — ones that come (almost) free
To pursue any of these options, you need to both know what your channel mix is, and understand how different user cohorts perform against each other. This requires having a proper attribution model in place.
Understanding the channel mix
Each marketing platform has a nice reporting tool that provides rich functionality with lots of metrics and drill-downs available. These let you run creative and audience tests in order to make informed decisions. However, reporting is limited to each specific channel. When you have questions like “how do channels perform against each other?”, you have to look at multiple tools and consolidate their data into a single report (good old spreadsheet).
Moreover, when users interact with multiple platforms, each of these platforms assigns the credit to itself. Finally, organic conversions are out of the picture if you’re only looking at channel reporting. Using tools like GA helps to see the overall picture, but the data often lacks quality and coverage. In the end, having in-house event tracking helps to build your own attribution model where you track the origin of most users, decide what the rules of credit assignment look like, and see the channel mix based on these rules.
Self-reported channels
When you see Direct as the biggest bucket in GA, it means that either something is wrong with your tracking or you have very strong organic conversion — the former being more likely. Anyhow, self-reported channels, also known as HDYHAU (how did you hear about us?) surveys, are an important piece in the puzzle.
You can use them in conjunction with tracked values to produce the best course of action around the channel, like:
- If there is a paid tracked channel, use it and ignore the HDYHAU answer
- If there is an organic tracked channel and paid HDYHAU answer, use the latter
- If both are organic, use the tracked one
Prioritize paid above organic and tracked over self-reported data, and you will get the best estimate of the channel mix.
Cohorts versus snapshots
A cohort is a set of users that shares the same landing time. When data is grouped by landing time, it is called cohort reporting. Cohort reporting answers questions such as “where did the users come from in Jan, and how did they convert?” Even though actual conversions might happen in Feb, it doesn’t matter. The reference point is when they landed the first time, and if there is no landing recorded for a given user, we consider the first business event as the landing time.
For example, 80% of users in the Jan cohort belong to it based on the landing time, while the remaining 20% appeared because they don’t have associated landing data, but they registered their accounts in Jan. This part is reported as direct source if there is no self-reported option to use in the source definition. It’s important to note that values in cohort-based reports change over time as more and more users convert (you can look at the conversion curve example in this article under Handling Time Window).
On the other side, snapshot reporting is based on the event/transaction date. Snapshot reporting answers questions such as “where did the users who ordered in Jan come from?” Values in snapshot based reporting don’t change over time because the events already happened.
For marketing reporting, cohort approach is preferable. When marketing spend happens, you want to tie further conversions to spend dates. This is particularly important for high growth companies that are scaling up spend, and for companies with longer conversion cycles. When you have increased your spend and look at a snapshot report, you’re not seeing the full effect of the increased spend yet because conversions are a lagging indicator. Conversions that come from the increased spend will appear as a part of the week/month number. With a cohort-based report, you will see the real effect of the spend.
It is important to understand that when you are looking at cohort-based marketing report numbers, the numbers will never match other business reports that are snapshot-based because of different time bucketing of the same data.
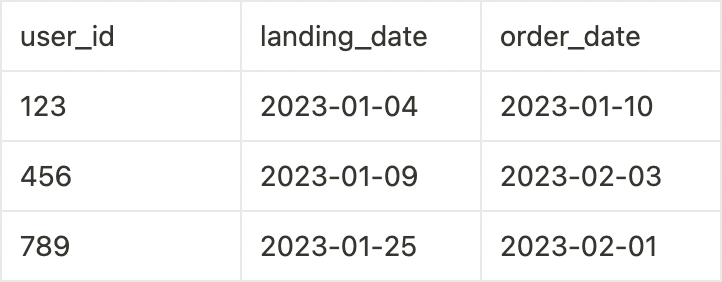
This example would yield 3 orders in the Jan bucket and 0 orders in the Feb bucket in a cohort-based report vs 1 order in Jan bucket and 2 orders in Feb bucket in a snapshot-based report.
Using data from a snapshot-based report might be misleading when it comes to making decisions like shutting down the channel that doesn’t work well (maybe the conversions haven’t yet accumulated for the cohort).
Consolidated reporting
Another big problem with relying solely on channel reporting tools is that you see the funnel only up to where you track it with channel tracking. Beyond that, you are pretty much blind. You can see the paying conversions in the best case, but quite often you’re just doing lead generation on the platforms and then you have a pipeline that lives somewhere in Salesforce.
The marketing team is happy as long as they hit their acquisition cost goal for their target event. A job well done for the marketing team puts the burden on other teams to get most out of newly generated leads, or to keep the subscribers paying. Understanding the link between CAC and LTV at the cohort/channel/user level is impossible without an attribution model. Having it in place allows building consolidated reporting across the full user journey that answers such value-oriented questions like:
- What is the ultimate ROI for our lead generation effort?
- What is our net CAC (spend divided by the N of purchases that didn’t cancel)?
- How does LTV for subscribers that came from this new channel compare with that of other channels?
Conclusion
A proper attribution model is paramount in building a holistic view of your company’s acquisition efforts. Linked to a further customer journey, it allows gauging unit economics outcomes across channels and cohorts. Check out this article for more details about building such a model.


Related Article

Tension of AIs


The author